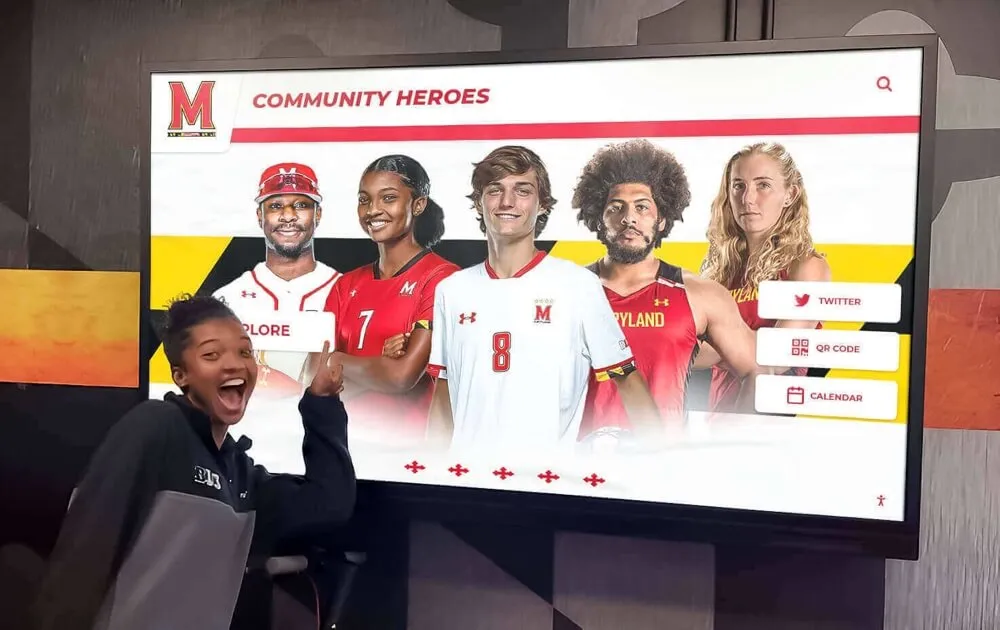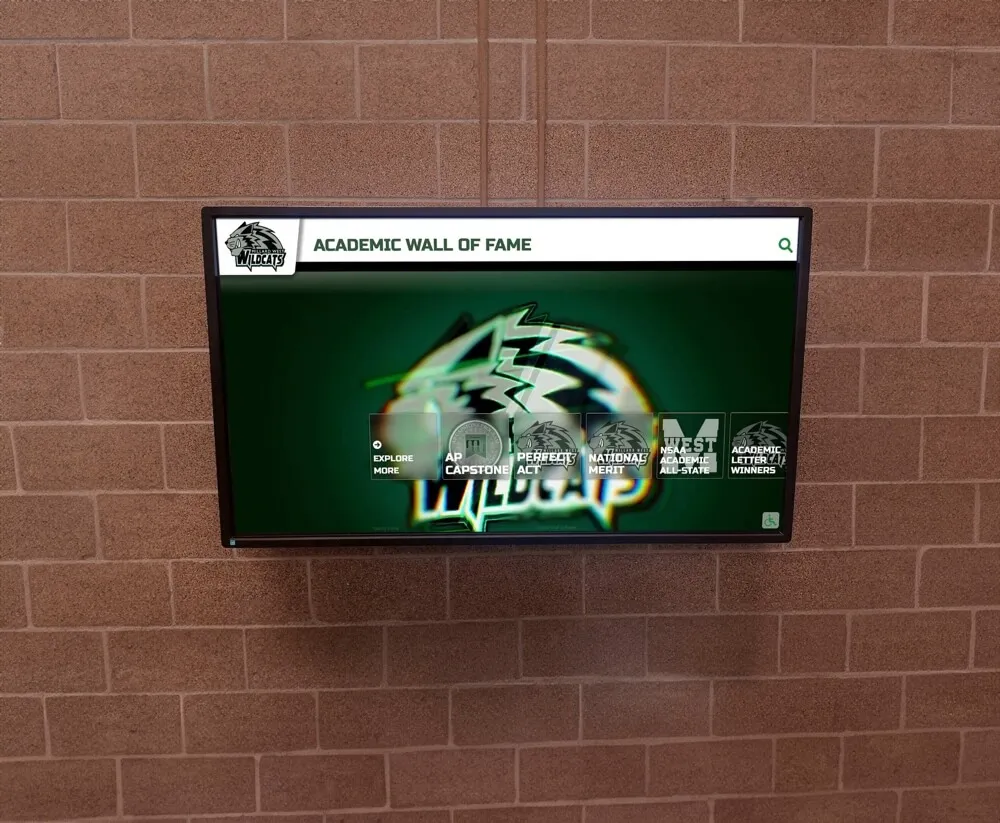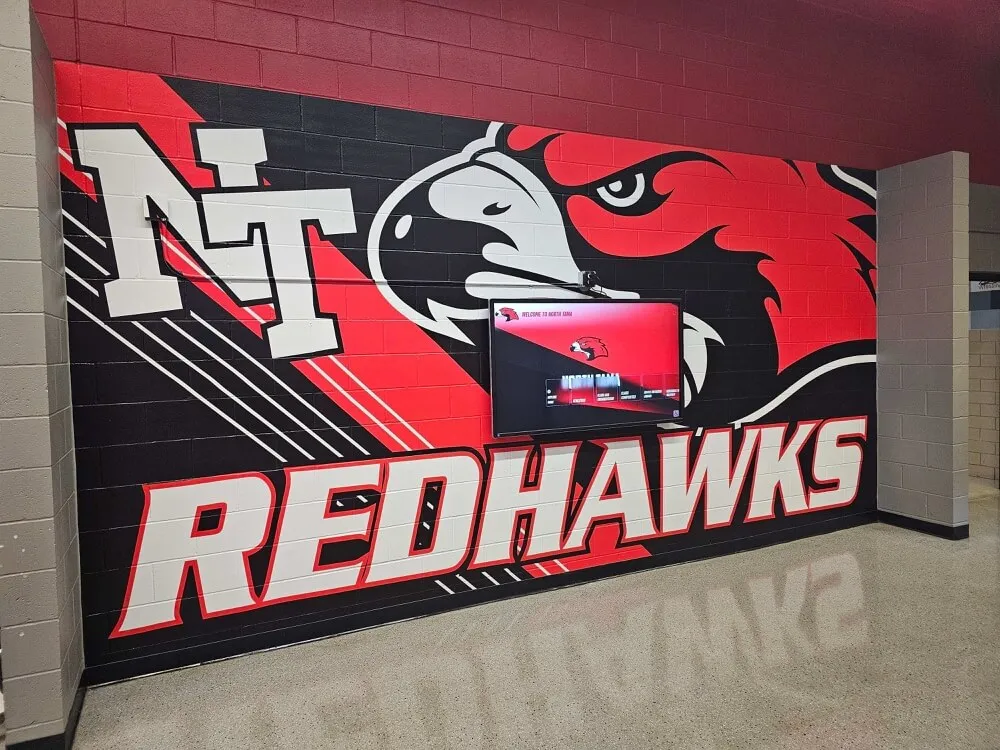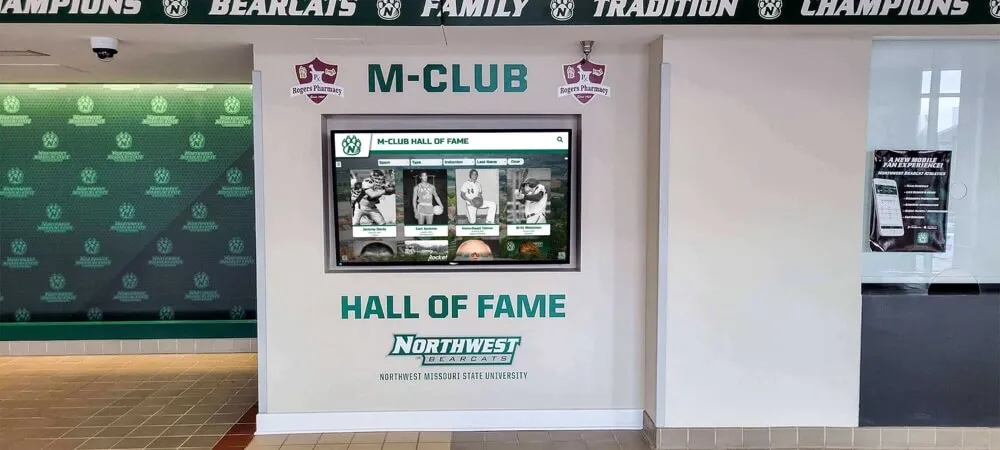
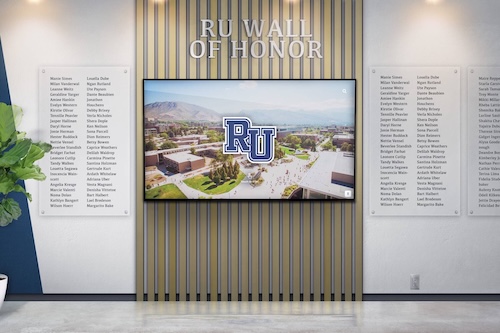
When a school’s athletic hall of fame display loads athlete portraits slowly or freezes mid-video during a championship celebration, the IT team faces a diagnostic puzzle: is the cause a slow content delivery server, a misconfigured application, or actual packet loss on the campus network? Without a documented baseline for TCP retransmission rates at the display’s network location, there is no reliable way to answer that question. Every slowness complaint becomes a guessing exercise — swapping cables, rebooting devices, and logging tickets with the platform vendor without knowing which layer is actually responsible.
A school recognition display TCP retransmission baseline is a measured reference point that tells IT teams what normal TCP retransmission behavior looks like at each display location on a healthy network day, so that when slowness is reported, observed retransmission rates can be compared against that reference rather than against a generic rule of thumb. This guide walks school IT coordinators, athletic technology staff, and facilities teams through establishing that baseline, interpreting the numbers, and using it to confidently direct blame — network, application, or media server — when a display’s media loads are unacceptably slow.
Quick answer: A school recognition display TCP retransmission baseline is established by running a packet capture or TCP statistics poll at the display’s network interface during a normal operating period — no events, typical school-day campus traffic — and recording the retransmission rate as a percentage of total TCP segments sent. A healthy baseline for a wired 1 Gbps recognition display on a well-managed campus network falls below 0.5%. When a display reports slow media loads, comparing the real-time retransmission rate against this baseline distinguishes network loss (retransmissions elevated above baseline, with correlated slow loads) from application or CDN problems (retransmissions at or near baseline but loads still slow). Elevated retransmissions point to the network; baseline-level retransmissions with slow loads point to the platform or media server.

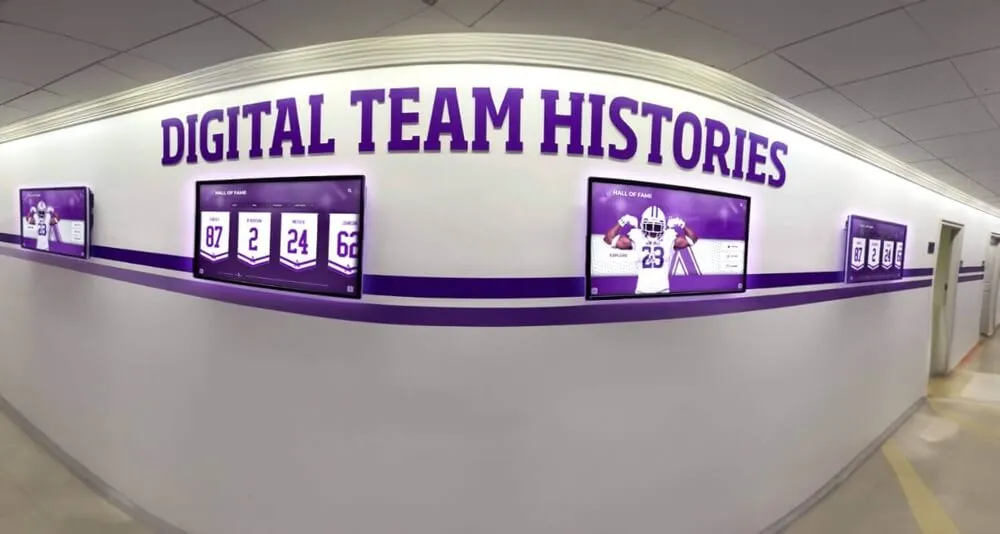
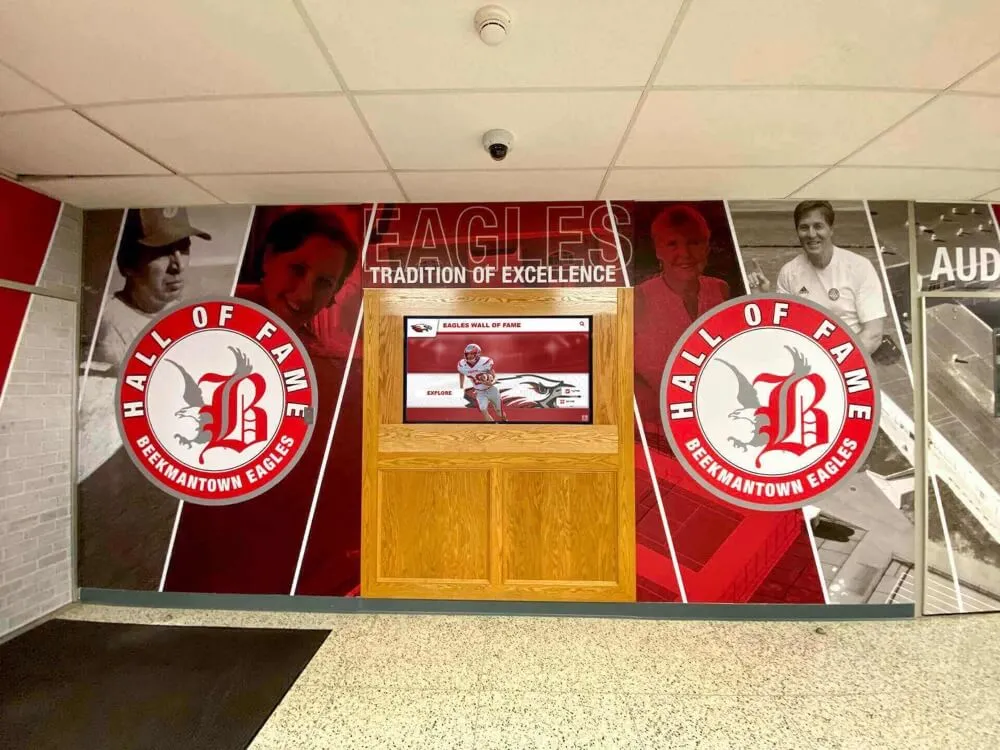
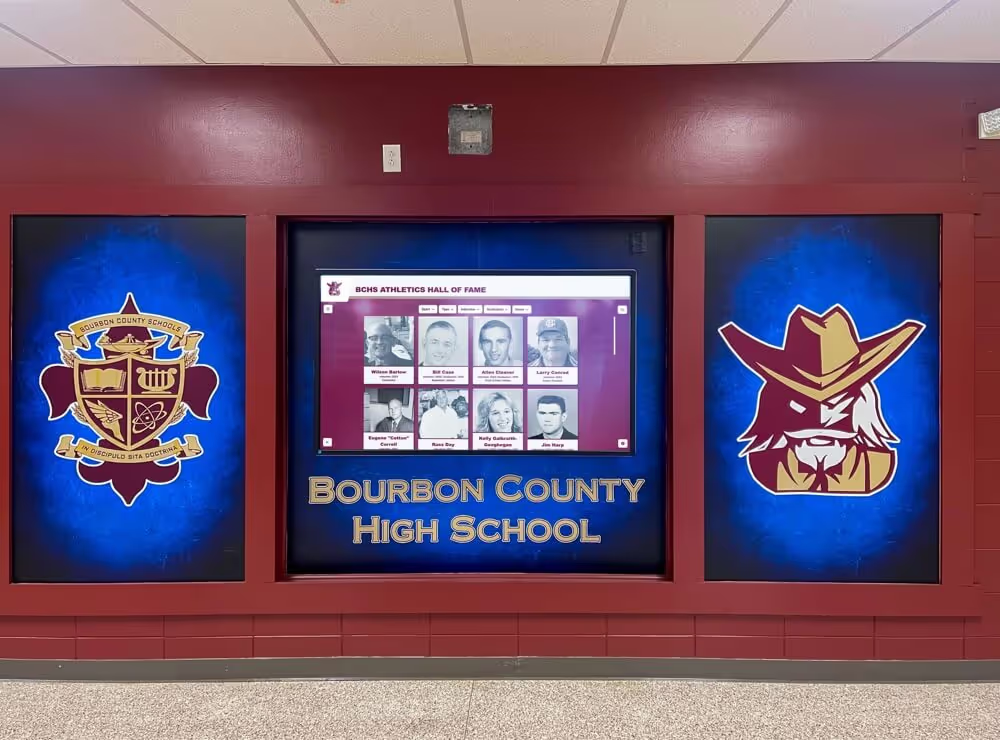
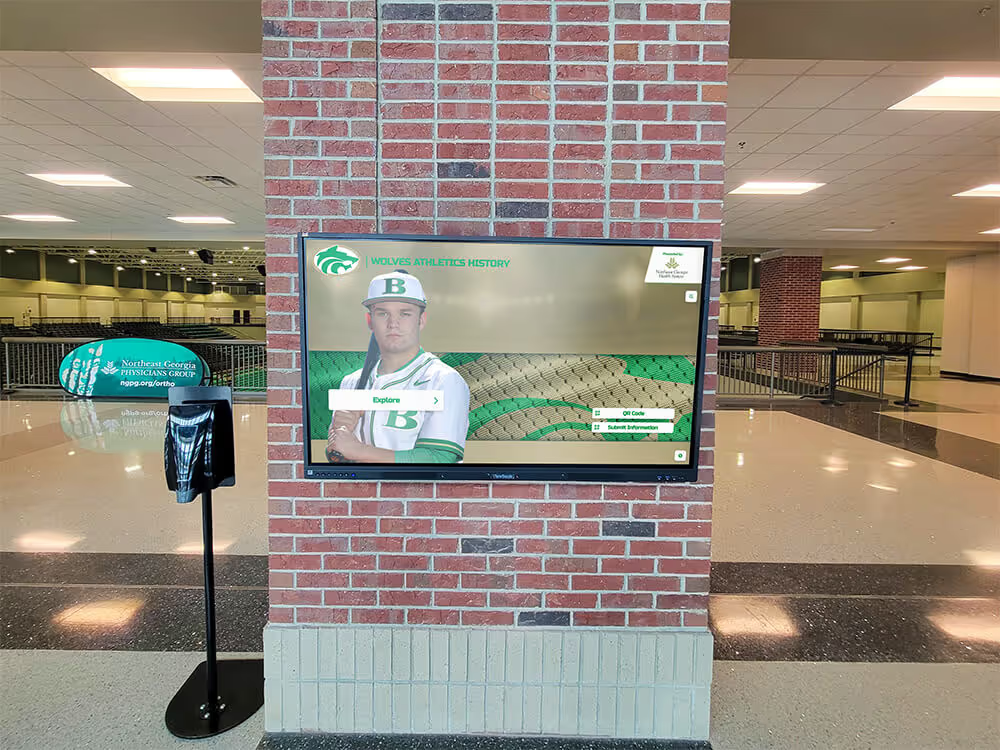
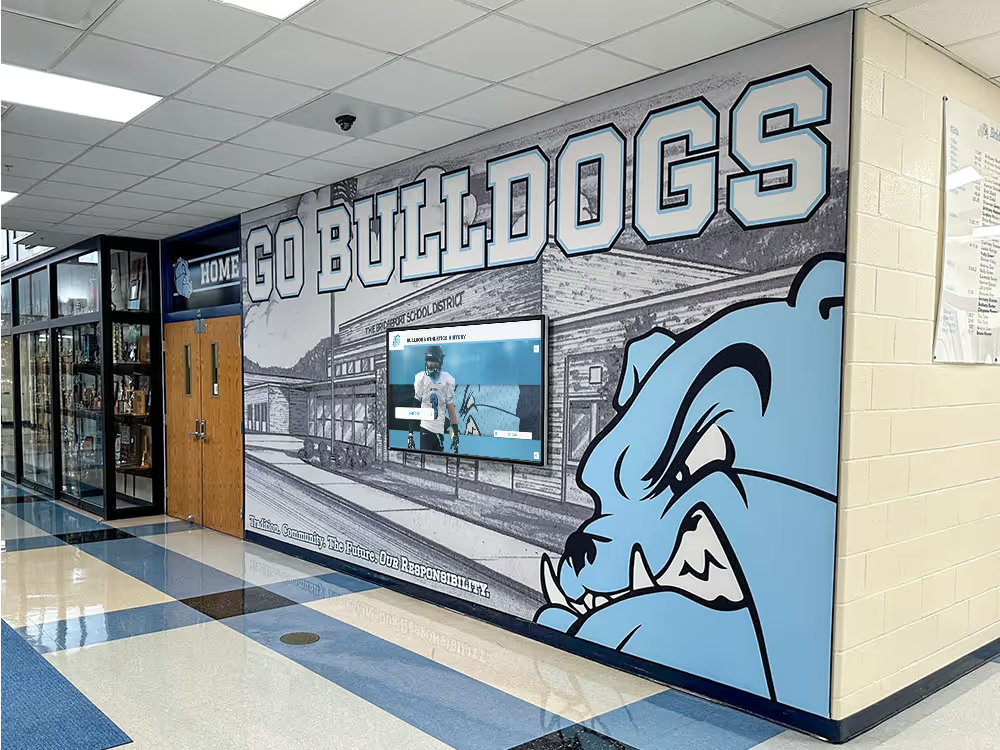
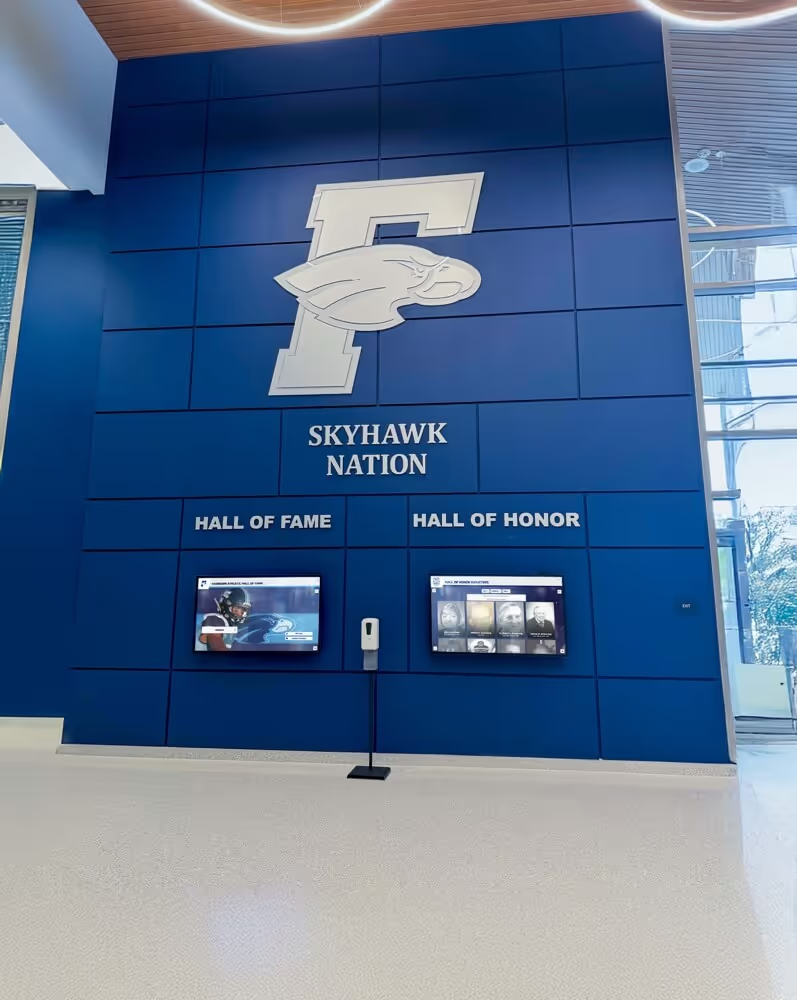
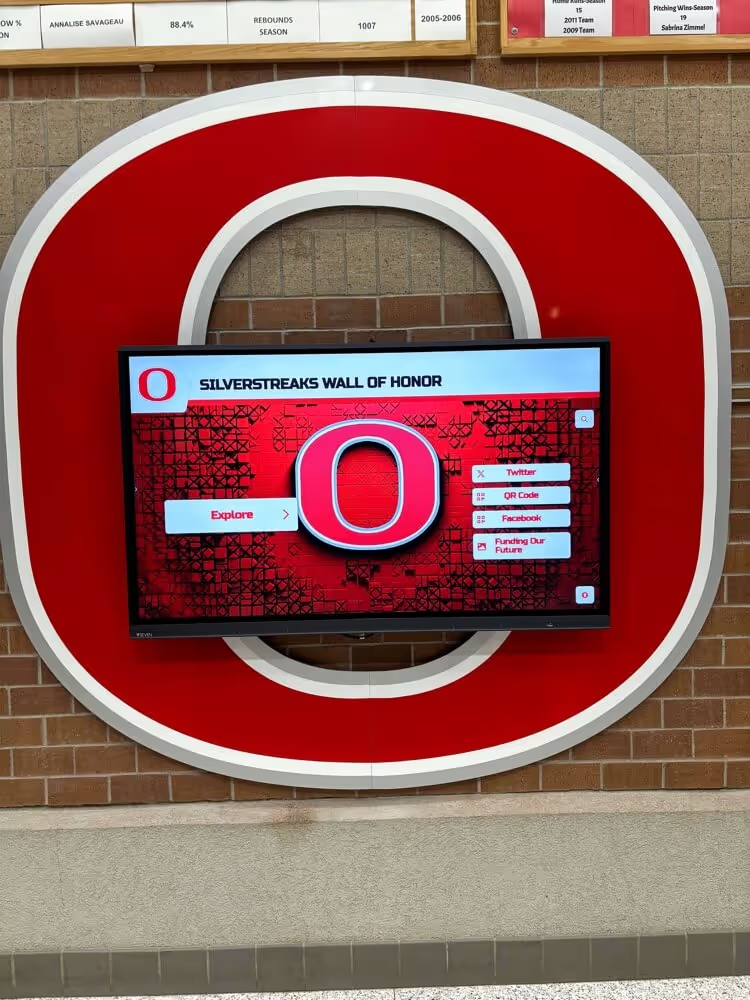
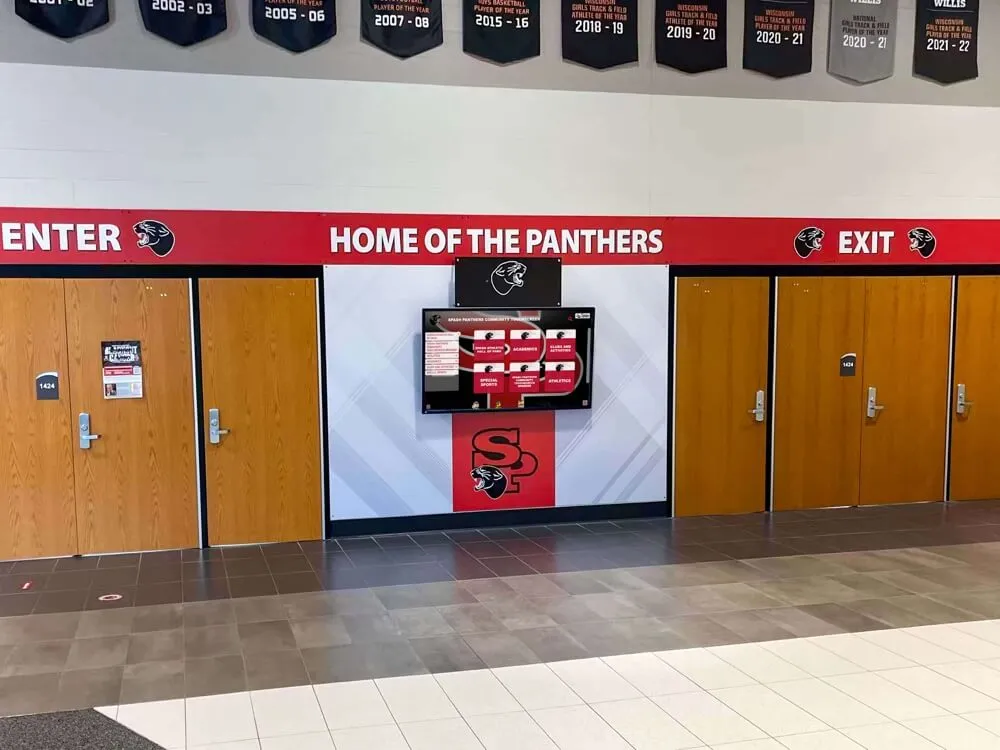
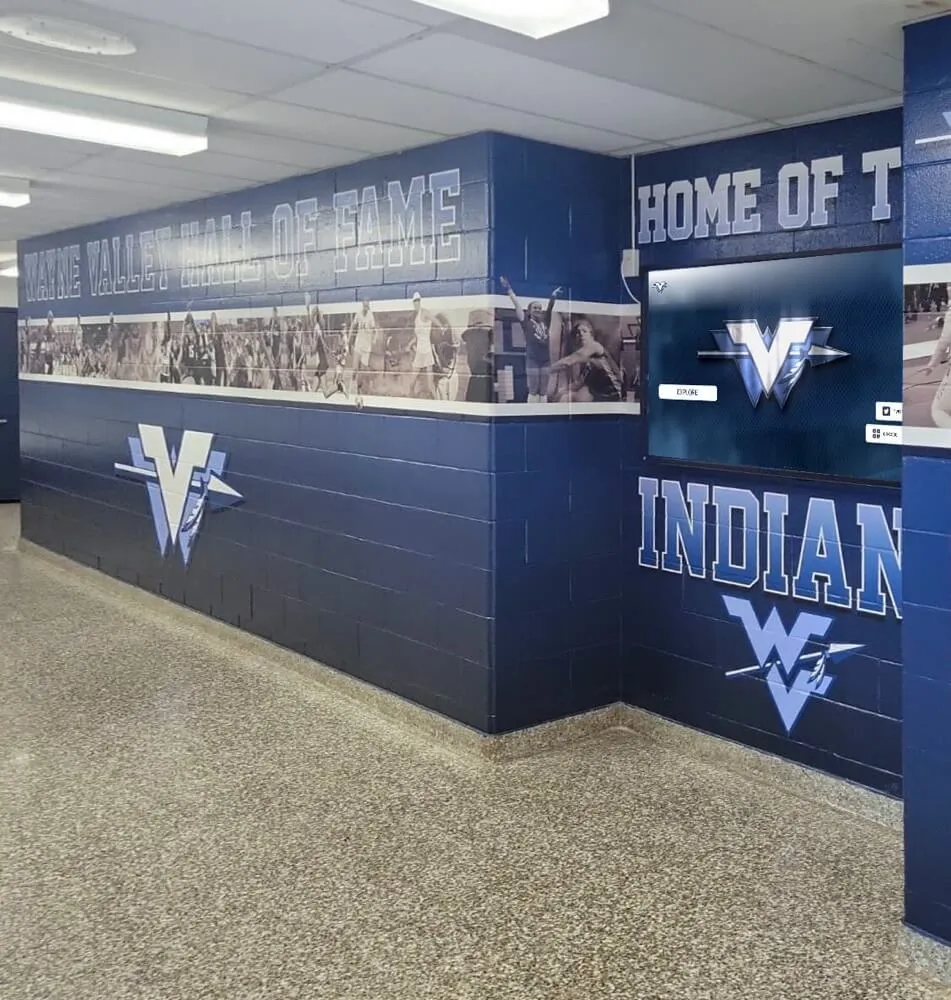
A recognition display in a school athletics hallway depends on reliable media delivery to show athlete portraits and award records at full resolution — the TCP retransmission baseline gives IT teams the reference point needed to decide whether a slow-loading display is a network problem or a platform problem
What TCP Retransmission Is and Why It Matters for Recognition Displays
TCP (Transmission Control Protocol) guarantees reliable delivery by requiring the receiver to acknowledge every segment it receives. When a sender does not receive an acknowledgment within a timeout window, it retransmits the segment — it sends the same data again, assuming the original was lost or corrupted in transit.
On a healthy campus network with a well-maintained cabling plant, very few segments are lost. The retransmission rate stays near zero because the physical and data-link layers deliver frames reliably. On a network with a deteriorating cable, a congested switch port, a duplex mismatch, or a failing NIC, segments are lost regularly and the retransmission rate climbs.
For a school recognition display, retransmissions have an outsized effect on perceived performance because of what the display is delivering:
- High-resolution athlete portraits: A 4 MB JPEG portrait of a championship-era athlete is transferred as thousands of TCP segments. A 2% retransmission rate means dozens of those segments are resent, adding hundreds of milliseconds to the load time that visitors observe as the image appearing slowly or appearing blurry before sharpening.
- Video highlight clips: Video is time-sensitive. A 30-second highlight reel transferred over HTTP adaptive streaming loses its smooth playback when retransmissions cause the buffer to empty faster than it refills. The result is buffering pauses visible to anyone standing at the display during a busy event.
- Cloud content synchronization: Recognition platform sync operations transfer batches of updated inductee records, award histories, and photo galleries. A retransmission rate that doubles sync transfer time can push the operation past the platform’s timeout, causing the sync to abort and leaving the display with stale content before a ceremony.
Schools that maintain rich recognition programs with athlete archives and multi-sport award histories on interactive displays invest significant effort in building and maintaining the content that fills those screens. Reliable TCP delivery is the final link in the chain from content database to lobby visitor — a high retransmission rate silently degrades that delivery without triggering any visible error or alert.
Why a Baseline Matters More Than a Generic Threshold
General guidance often states that a TCP retransmission rate above 2% indicates a network problem. That rule of thumb is useful as a starting point but is inadequate on its own for diagnosing recognition display problems.
Campus network behavior varies by location. A recognition display wired directly to a core switch in the main athletic lobby operates in a very different network environment than one connected through a 25-year-old Cat5e run in an auxiliary gymnasium. The structured cabling, intermediate patch panels, and adjacent switch ports all affect the baseline retransmission rate independently of any congestion issue. A 1.5% retransmission rate might be normal for the auxiliary gym display and abnormal for the main lobby display.
Baseline captures your environment, not a textbook. When the athletic director reports that the trophy corridor display is loading slowly before a parent night, a baseline number recorded during a normal school day gives IT a specific reference point: “normal for this display is 0.3% retransmission; current rate is 2.8% — the network is the problem.” Without that baseline, the only options are to replace cables speculatively or call the platform vendor, neither of which is efficient.
Schools planning to recognize youth athlete of the year honorees or other high-profile inductees on a recognition display need the display to perform reliably during the ceremony. A pre-event retransmission check against a documented baseline is the fastest way to confirm the network is ready.
What to Measure: TCP Statistics Sources for Recognition Displays
Before running the baseline, identify which data sources are available in your environment. The choice of tool determines what you can measure and how frequently.
| Data Source | What It Measures | Collection Method | Best For |
|---|---|---|---|
ss -ti on Linux display | Per-connection retransmit count | Run on the display device | Spot-check; shows active connection retransmit counts |
netstat -s on Linux or Windows | Cumulative TCP retransmission counters since boot | Run on the display device | Trending over a session; reset on reboot |
tcpdump or Wireshark PCAP | Per-segment retransmission events with timestamps | Run on display or via a span/mirror port | Precise baseline capture with per-connection detail |
| Switch port SNMP OIDs (ifInErrors, ifOutErrors) | Layer 2 error counts at the port level | Polled by a network monitoring platform | Passive continuous monitoring without touching the display |
iperf3 with TCP retransmit reporting | Retransmissions during a controlled throughput test | Run between display and a test server | Load-correlated baseline revealing congestion-dependent retransmissions |
For most school recognition display deployments, the most practical combination is:
ss -tiornetstat -son the display device for rapid on-device spot-checks- A controlled
tcpdumpcapture during normal operating hours for the recorded baseline - Switch SNMP polling for passive ongoing monitoring after the baseline is established
Step 1: Choose a Baseline Measurement Window
A baseline captured during an atypical period produces a misleading reference point. Choose the measurement window to match the conditions under which the display normally operates.
Select a normal school-day period. The baseline should be captured during a typical school day — not during a half-day, a holiday, a testing blackout when student devices are offline, or the summer when campus network load is near zero. The goal is to capture what normal looks like when all the competing network traffic that also exists on problem days is present: student devices authenticated on the WLAN, security cameras streaming, administrative systems syncing, and digital signage on adjacent VLANs pulling updates.
Avoid event days. Capturing a baseline during a homecoming, an all-school assembly, or a tournament day includes atypically high campus network load in the reference. That inflated baseline would mask genuinely abnormal retransmission rates during future events.
Run the capture across three time windows. Each window captures a different part of a typical school day’s traffic pattern:
- Morning arrival (7:30–8:15 a.m.): student devices authenticate, recognition platform syncs run, administrative traffic peaks
- Mid-day (11:00 a.m.–12:30 p.m.): steady-state traffic with moderate load
- After-school (3:00–4:00 p.m.): dismissal traffic spike, end-of-day sync operations
Capturing across all three windows reveals whether the retransmission rate is consistent or peaks at specific times of day. A display whose retransmission rate spikes during arrival but is normal mid-day has a congestion-related problem, not a cabling or NIC problem — the baseline reveals this pattern before any troubleshooting begins.
Step 2: Capture the Baseline Using tcpdump and Analyze with Wireshark
The most reliable baseline capture method uses tcpdump on the display device to record a packet capture file, then analyzes the capture in Wireshark to extract the retransmission rate.
Step 2a: Start the capture on the display device
sudo tcpdump -i eth0 -w /tmp/display-baseline.pcap -G 900 -W 1 'tcp'
This command captures TCP traffic on eth0 for 900 seconds (15 minutes). Adjust -i eth0 to match the display’s actual interface name, which can be confirmed with ip link. The -G 900 -W 1 combination writes a single 15-minute file rather than a continuous rolling capture.
Step 2b: During the capture, trigger normal display operations
Do not let the display sit idle during the capture — a display serving no content requests will show near-zero retransmissions, which would produce a misleadingly optimistic baseline. During the capture window:
- Trigger a content refresh from the recognition platform’s admin dashboard
- Touch the display to browse athlete records and navigate between categories
- If the display auto-refreshes on a schedule, confirm that at least one scheduled refresh occurs during the capture
Step 2c: Transfer the capture file and open it in Wireshark
scp /tmp/display-baseline.pcap user@workstation:/tmp/
In Wireshark, apply the tcp.analysis.retransmission display filter to show only retransmitted segments:
tcp.analysis.retransmission
Step 2d: Calculate the baseline retransmission rate
From Wireshark’s Statistics → Capture File Properties:
- Note the total TCP packet count
- Note the count of packets matching
tcp.analysis.retransmission - Calculate: Retransmission Rate = (Retransmitted Packets ÷ Total TCP Packets) × 100
Document this figure as the baseline for this display location.
Step 2e: Alternative — use ss -s for a rapid device-side measurement
If a full packet capture is not immediately practical, /proc/net/snmp on the display device provides cumulative TCP statistics:
cat /proc/net/snmp | grep -A1 Tcp
The RetransSegs field in the Tcp row is the cumulative retransmitted segment count since boot. Take two readings 60 seconds apart and compute the approximate rate using the OutSegs delta as the denominator:
Rate ≈ ((RetransSegs_t2 − RetransSegs_t1) ÷ (OutSegs_t2 − OutSegs_t1)) × 100
For per-connection retransmission detail, use:
ss -ti
The output includes retrans:X/Y for each established TCP connection, where X is the current count and Y is the lifetime count for that connection.
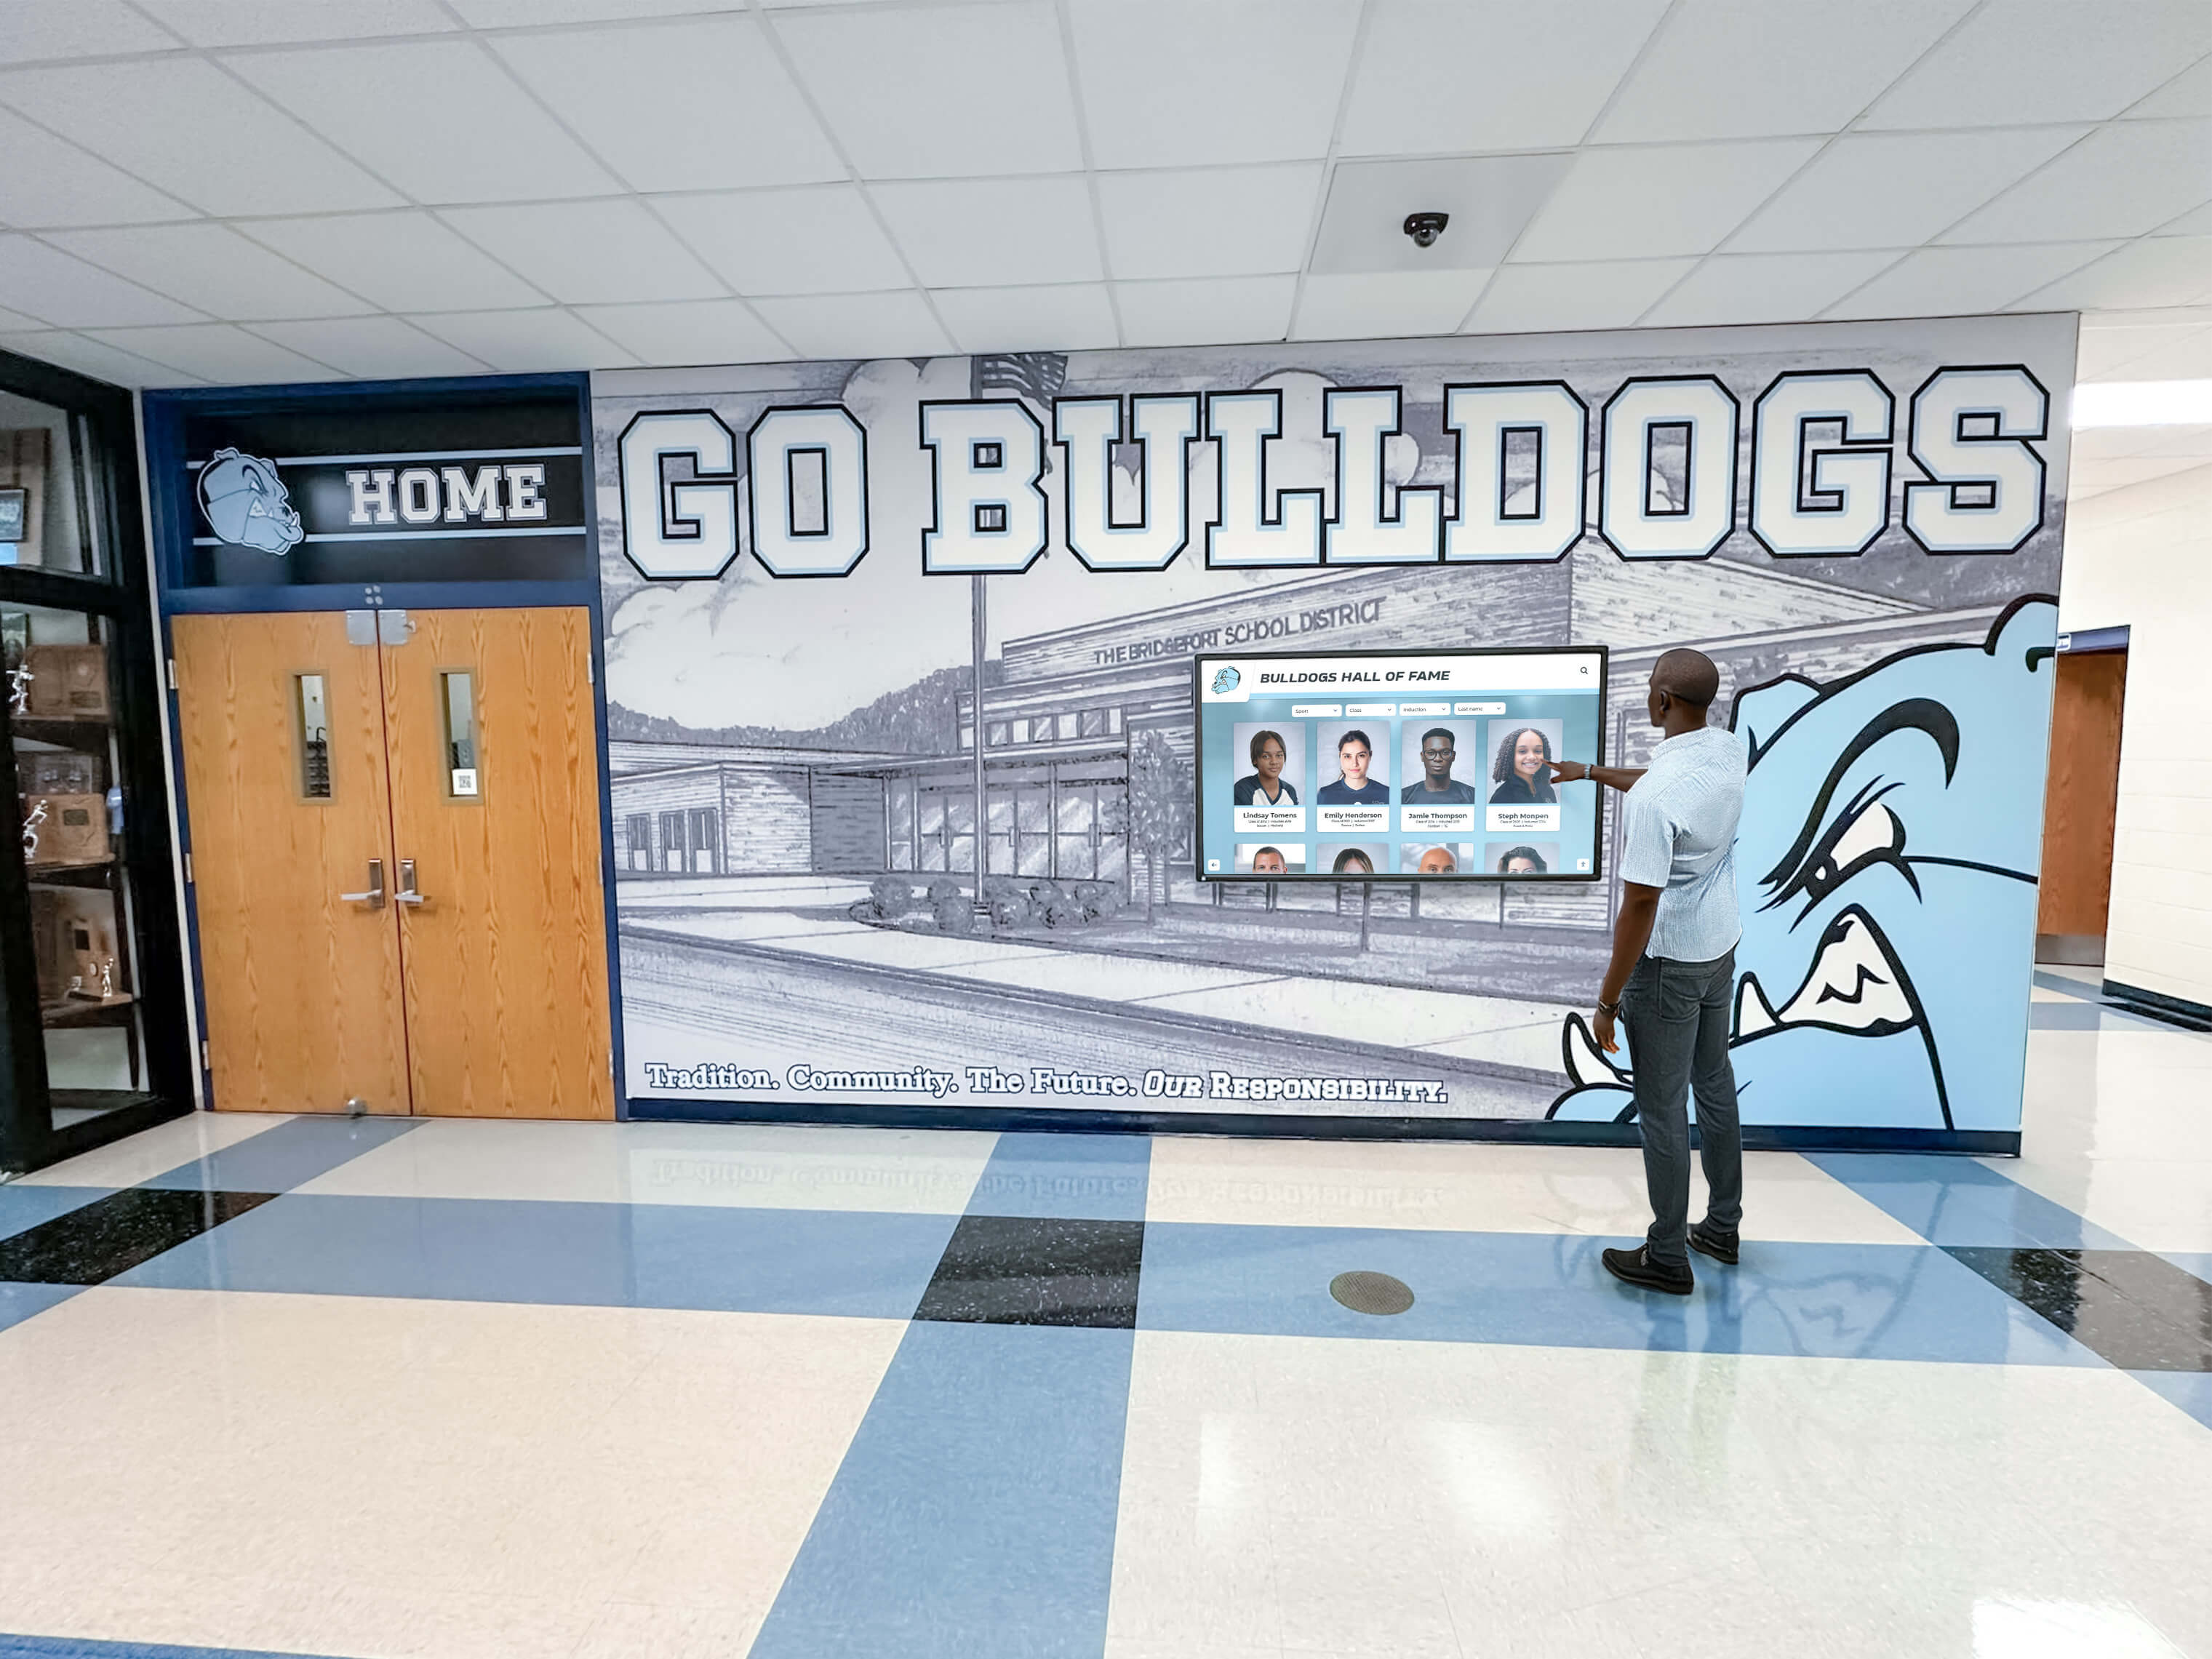
Triggering normal display operations during the baseline capture — navigating athlete records, loading portrait galleries, allowing scheduled sync operations — ensures the baseline reflects the TCP behavior that occurs during everyday use rather than just idle state
Step 3: Interpret the Baseline Numbers
After the capture and analysis, classify the baseline retransmission rate using this reference table. Note that these ranges apply to wired Ethernet connections; Wi-Fi-connected displays will typically show higher baseline retransmission rates due to the inherent wireless retry mechanism, and their baseline should be established and interpreted separately.
| Baseline Retransmission Rate | Classification | Implication for Recognition Displays |
|---|---|---|
| 0.0–0.3% | Excellent | Network is not contributing to media load slowness; investigate application or CDN if loads are slow |
| 0.3–0.8% | Good | Normal for most school campus networks; minor retransmissions will not meaningfully affect large image or video load times |
| 0.8–1.5% | Marginal | Investigate physical layer: cable quality, patch panel connections, switch port health; monitor before major events |
| 1.5–3.0% | Elevated | Network is likely contributing to slow media loads; perform root cause analysis before scheduling content-heavy events |
| Above 3.0% | Problematic | Network is causing visible degradation of video and large image delivery; prioritize remediation before any recognition event |
A display baseline that falls in the Marginal or Elevated range on a normal school day should be investigated before the next major recognition event — a basketball induction night, a spring athletic banquet, or a signing day ceremony — because event-day campus network load will worsen the retransmission rate and push slow media loads into visibly disruptive territory.
Schools that run multi-sport recognition programs, preserving wrestling award histories alongside other athletic records, often schedule multiple content-heavy updates in the weeks leading up to end-of-year banquets. Those update cycles are exactly when an elevated baseline becomes a visible problem — new inductee photos take minutes to load where they should take seconds.
Step 4: Run a Load-Correlated Baseline to Catch Congestion-Dependent Retransmissions
Some displays show an excellent retransmission rate during normal operations but experience elevated retransmissions only when the campus network is under load — during arrival, during events, or during district-wide software update windows. A standard baseline capture may miss this behavior.
Run a load-correlated baseline using iperf3 to measure retransmissions under controlled throughput conditions:
Step 4a: Set up iperf3 between the display and a local server
On a server on the same campus network (not on the internet):
iperf3 -s
On the display device:
iperf3 -c <server-ip> -t 120 -P 4 --get-server-output
The -P 4 flag runs four parallel streams, simulating the type of concurrent HTTP/2 connections a recognition platform uses when loading multiple athlete portrait images simultaneously.
Step 4b: Note the retransmission count in the iperf3 output
iperf3 reports retransmissions in its summary output:
[ ID] Interval           Transfer     Bitrate         Retr
[  5]   0.00-120.00 sec  10.8 GBytes   773 Mbits/sec    3             sender
Retr: 3 across a 120-second full-throughput test is excellent. A display showing Retr: 847 in the same test has a significant physical or congestion problem that will directly impair large image and video delivery.
Step 4c: Repeat during a simulated peak-traffic period
If possible, run the iperf3 test during first period or during an event when campus network traffic is high. Compare the retransmission count to the normal-hours test. If retransmissions increase by more than 3× during peak hours, the display’s performance during events will be meaningfully worse than during normal school hours — and the pre-event troubleshooting priority increases accordingly.
Step 5: Document the Baseline Across All Display Locations
A single baseline for the main athletic lobby display is more useful than no baseline, but a complete baseline record covering every recognition display in the school gives the IT team a comparative picture. Displays that share the same switch or uplink have correlated retransmission rates — a baseline showing one display at 0.3% and another at 2.1% on the same switch segment points immediately to a port-specific or cabling-run problem rather than a campus-wide issue.
Document baseline results in the school’s IT asset management system:
| Display Location | Interface | Switch Port | Baseline Retr. Rate | Capture Date | Classification | Notes |
|---|---|---|---|---|---|---|
| Athletic Lobby — HOF Kiosk | eth0 | Gi1/0/12 | 0.31% | 2026-09-13 | Good | Directly wired to core switch; 1 Gbps full-duplex |
| Gym Entrance — Trophy Display | eth0 | Gi1/0/14 | 0.88% | 2026-09-13 | Marginal | Cat5e run through equipment room; patch panel in loop |
| Library — Alumni Wall | eth0 | Gi2/0/3 | 0.29% | 2026-09-13 | Excellent | Recently upgraded cabling; dedicated port |
| Trophy Corridor — Awards Screen | eth0 | Gi2/0/7 | 1.72% | 2026-09-13 | Elevated | Investigate cabling; schedule remediation before fall banquet |
The gym entrance display and trophy corridor display warrant investigation before a major event. The baseline record creates the operational justification for those infrastructure tickets — without the baseline, a cabling replacement request is speculative; with it, the measured retransmission rate is the evidence.
School recognition displays perform best when the network path delivering their content is verified and documented. Rocket Alumni Solutions builds recognition platforms designed for school environments, with compatibility guidance and IT resources for network teams establishing display baselines and connectivity requirements.
Using the Baseline to Diagnose Slow Media Loads in Real Time
When an athletic director, principal, or facilities staff member reports that a recognition display is loading slowly, the TCP retransmission baseline becomes the primary diagnostic tool. Follow this sequence:
Step A: Take a current retransmission reading
On the display device, take two readings of /proc/net/snmp 60 seconds apart and compute the approximate retransmission rate using the delta in RetransSegs and OutSegs. For a faster check with active connections visible:
ss -ti | grep retrans
Step B: Compare against the documented baseline
| Observed vs. Baseline | Conclusion | Next Diagnostic Step |
|---|---|---|
| Retransmissions significantly above baseline AND loads are slow | Network is the cause; packet loss is present | Run ethtool error counters; check switch port for errors; test cabling |
| Retransmissions at or near baseline AND loads are slow | Network is NOT the cause | Check platform server health; test from a PC on the same VLAN; contact platform vendor support |
| Retransmissions significantly above baseline but loads appear normal | Network has degraded; local cache is masking the problem | Schedule network remediation; cache will not mask the problem indefinitely |
| Retransmissions at or near baseline AND loads are normal | No problem detected | Document and close the report |
This two-variable diagnostic — retransmission rate relative to baseline plus observed load behavior — eliminates most guesswork and directs the IT team to the correct layer within minutes of receiving a slowness report.
Schools that store complete yearbook archives and multi-decade athletic history on recognition displays have content libraries large enough that a network problem will always surface during retrieval of the older, less-cached records. Those are also the records that visitors and alumni are most likely to search for during reunion events and homecoming nights — exactly when a slow network is most disruptive.
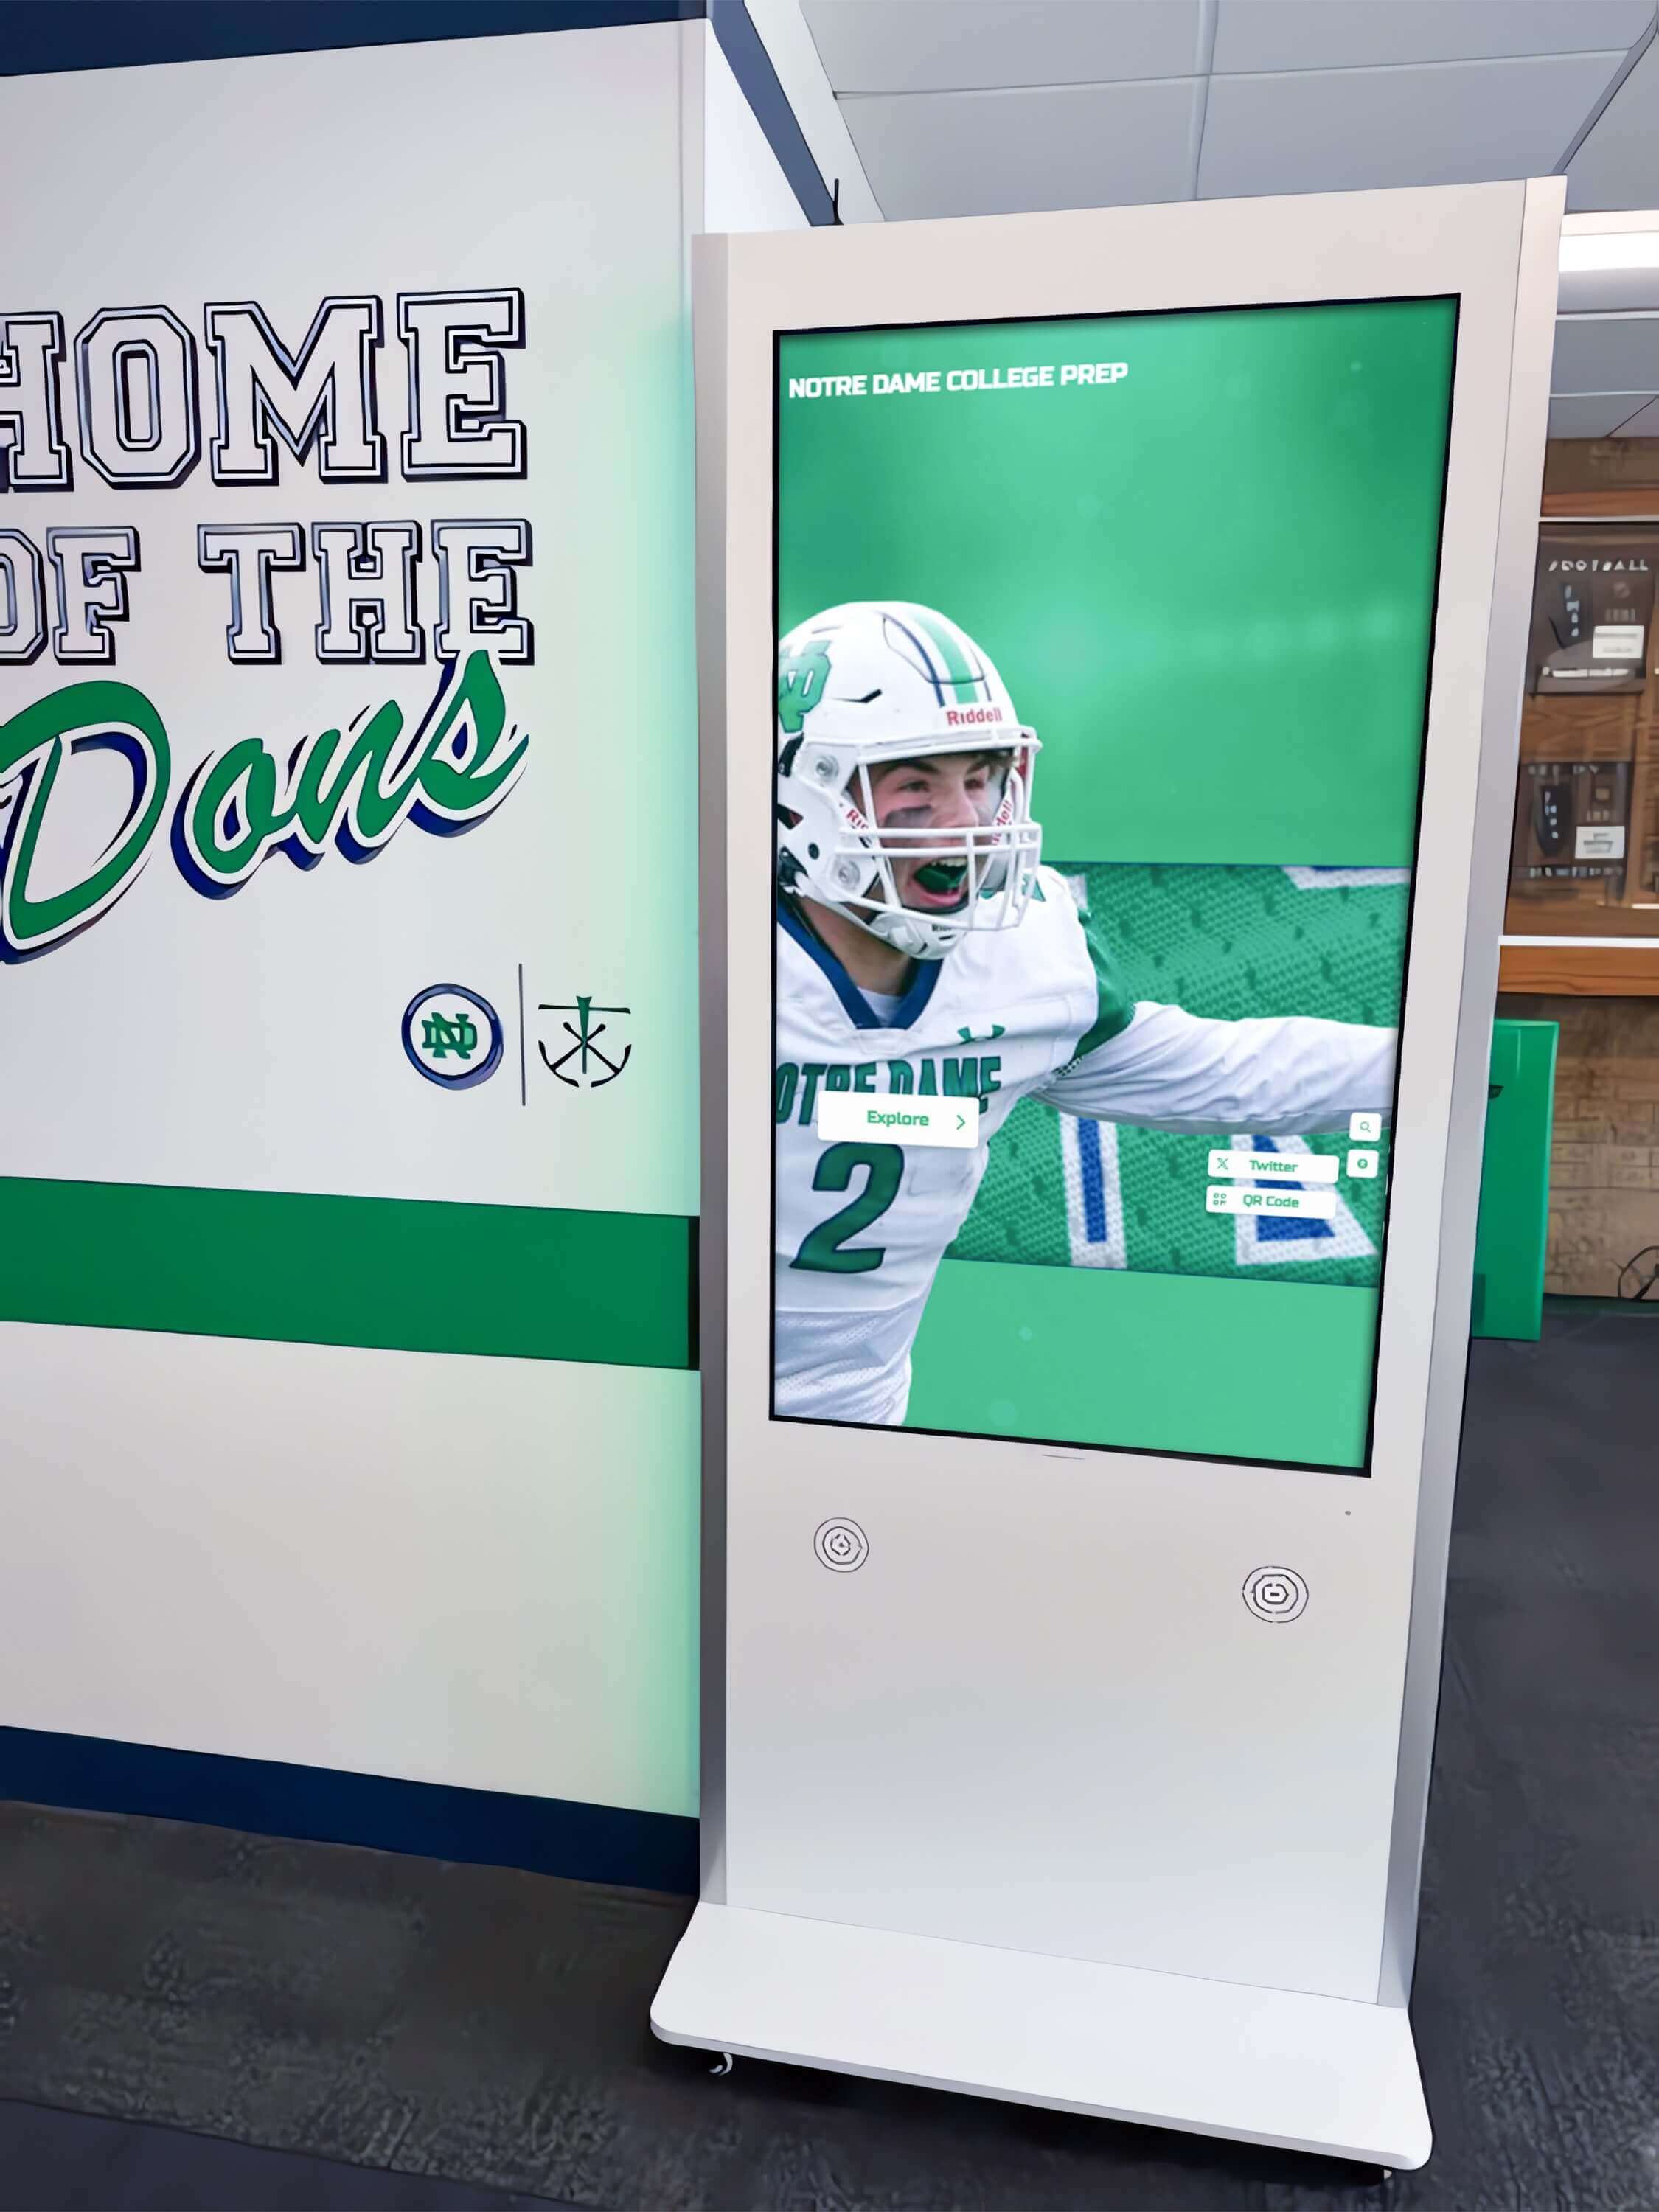
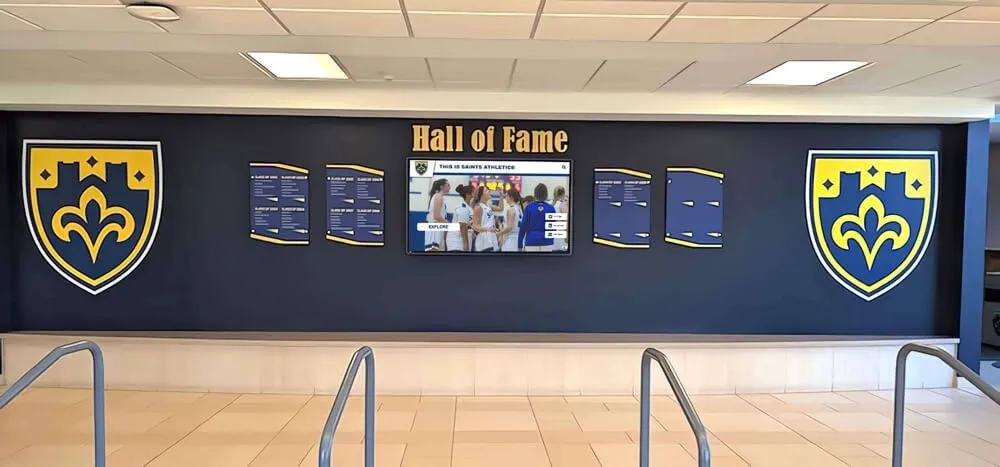
A recognition display kiosk that loads athlete records slowly during a recognition event is either experiencing network packet loss or a platform-side problem — the TCP retransmission baseline tells the IT team which it is within minutes of the report
Common Root Causes When Retransmissions Exceed the Baseline
When a current retransmission reading is significantly above the documented baseline, one of the following root causes is usually responsible. Each cause has a distinct diagnostic fingerprint.
Deteriorated cabling. A cable that was adequate at installation becomes marginal over years of physical stress — being walked on, bent around corners, and compressed under floor coverings. Marginal cables drop segments intermittently, raising retransmissions without triggering a full link-down event. Diagnostic fingerprint: retransmissions are present at all times of day, not only during peak traffic; replacing the patch cable between the display and the wall port improves the rate immediately.
Switch port error condition. A switch port accumulating CRC errors, input errors, or output discards will generate retransmissions on the attached device. Diagnostic fingerprint: switch port show interfaces output shows incrementing error counters; moving the display to a known-good port on the same switch produces a normal retransmission rate.
Congestion-induced loss. When the switch uplink or an intermediate segment is saturated, switch buffers overflow and discard packets. TCP senders retransmit the discarded segments. Diagnostic fingerprint: retransmissions are elevated only during peak-traffic periods; mid-day and after-school measurements are at or near baseline; uplink utilization in the monitoring dashboard shows near-100% during the affected window.
Duplex mismatch. A half-duplex device connected to a full-duplex switch port generates late collisions on the switch and retransmissions on both sides of the link. Diagnostic fingerprint: switch port shows a non-zero late collision counter; ethtool eth0 on the display shows Duplex: Half despite Speed: 1000Mb/s. See recognition display touch sensitivity testing for related display diagnostic procedures once the network layer is resolved.
NIC firmware or driver issue. A display device running outdated NIC firmware may have a known defect that causes spurious retransmissions even on a healthy network. Diagnostic fingerprint: a separate laptop connected to the same switch port and running a throughput test shows a near-zero retransmission rate, but the display device shows elevated retransmissions on the same port; resolves after NIC driver or firmware update.
Schools with recognition displays that have served yearbook-themed content and class history archives for several years often have display hardware that has not received a driver or firmware update since installation. A retransmission rate that has drifted upward over time, with no change in cabling or switch configuration, warrants a driver update check on the display device.
Troubleshooting Table: When the Baseline Comparison Points to the Network
When current retransmissions are above baseline and the network is confirmed as the cause, use this table to narrow to the specific problem before scheduling a repair.
| Symptom | Likely Cause | Diagnostic Command | Remediation |
|---|---|---|---|
| Retransmissions elevated at all hours | Physical cable degradation or bad switch port | ethtool -S eth0 | grep error; switch show interfaces <port> | Replace patch cable; test structured cabling run; move to a known-good switch port |
| Retransmissions elevated only during school hours | Congestion on shared uplink or segment | Monitor uplink utilization via SNMP; check switch buffer discard counters | Move display to a less-contended segment; apply QoS markings to platform traffic |
| Retransmissions elevated; switch shows late collisions | Duplex mismatch | ethtool eth0 | grep Duplex; switch show interfaces <port> errors | Enable auto-negotiation on both sides; or force both to 1000 full-duplex |
| Retransmissions elevated; switch port shows CRC errors | Physical layer fault (damaged cable, EMI) | Inspect for physical damage; test on a different switch port | New structured cabling run; port replacement |
| Retransmissions elevated only during content sync windows | Burst traffic exceeding switch buffer capacity | Check sync schedule; monitor switch buffer utilization during sync | Schedule syncs during off-peak hours; apply DSCP marking to platform sync traffic |
| Retransmissions at baseline but media still slow | Application, CDN, or server-side problem | Test the platform endpoint from a PC on the same VLAN; check platform status page | Escalate to platform vendor; check CDN configuration |
The final row is the most important outcome that a TCP retransmission baseline enables: definitive exclusion of the network as the cause. When retransmissions are at baseline but media is still slow, the IT team’s next contact is the platform vendor — not the cable crew or the network team. That redirection saves time and avoids unnecessary infrastructure changes that would not have resolved the problem.
Schools managing recognition programs alongside alumni and class history archives across multiple buildings often share IT staff. A documented retransmission baseline for each display location means a substitute IT coordinator handling a slowness report at an unfamiliar building can run the diagnostic sequence and reach the same conclusion as the staff member who originally commissioned the display.
Establishing a Pre-Event Verification Protocol
The TCP retransmission baseline becomes most operationally valuable as part of a pre-event verification protocol. Before each major recognition event — induction nights, athletic banquets, alumni gatherings — the IT team runs a rapid retransmission check to confirm the display is performing within its documented baseline.
A pre-event check takes approximately five minutes per display:
- Connect to the display device via SSH
- Run
ss -tiand note current retransmission rates for active TCP connections - Trigger a content refresh from the platform admin dashboard and observe load speed visually
- Compare the retransmission rate against the documented baseline
- If the rate is within 0.5 percentage points of baseline — proceed; display is network-healthy
- If the rate exceeds baseline by more than 1 percentage point — investigate before the event begins
Schools that honor youth athlete of the year recipients and similar inductees at formal ceremonies have a specific audience — families, coaches, and community members — for whom the display is part of the event’s presentation value. A display that loads the new inductee’s portrait slowly during the ceremony undercuts the moment. A five-minute pre-event retransmission check eliminates that risk.
Frequently Asked Questions
How often should the TCP retransmission baseline be recaptured?
Recapture the baseline after any of the following events: structured cabling replacement or new cabling run serving the display, switch replacement or switch port reassignment, network infrastructure upgrade, recognition platform OS or agent update that changes connection behavior, or any measured retransmission rate that has drifted noticeably from the previous baseline without a clear explanation. An annual baseline refresh during August, aligned with school-year startup, is a practical cadence for most school IT teams. Retain historical baseline values rather than overwriting them — a trend of rising baselines across multiple years indicates a slow physical infrastructure decline worth tracking.
Does a TCP retransmission baseline apply to Wi-Fi-connected recognition displays?
Yes, but Wi-Fi baselines require separate interpretation. Wi-Fi uses MAC-layer retransmissions handled by the 802.11 protocol in addition to TCP-layer retransmissions. A Wi-Fi display operating in a congested channel will show higher baseline TCP retransmission rates than a wired display on the same network. Establish the baseline specifically for each display on its actual connection type and location. Do not compare a Wi-Fi display’s baseline against a wired display’s baseline — they reflect different environments.
Should the baseline capture cover only traffic to the recognition platform, or all TCP traffic on the display?
Capturing all TCP traffic produces the most complete picture of the network environment, because retransmissions on other connections — OS updates, license checks, remote management traffic — reflect the same underlying network quality that affects platform traffic. For a focused baseline that isolates platform-specific retransmissions, use a tcpdump filter targeting only the platform’s IP range:
sudo tcpdump -i eth0 -w /tmp/platform-baseline.pcap 'tcp and host <platform-ip>'
Both approaches are valid. The all-traffic baseline is more practical for regular spot-checks; the filtered baseline is more precise for diagnosing a problem that seems isolated to platform content delivery.
What retransmission rate warrants replacing the patch cable before investigating further?
If the current retransmission rate is more than 2 percentage points above the documented baseline and the elevated rate appears consistently across different times of day, replacing the patch cable between the display and the wall port is the lowest-cost, lowest-risk first step — before running switch port diagnostics or escalating to the network team. A bad patch cable is a common and easily corrected cause of elevated retransmissions, and replacement takes less than five minutes. If the rate does not improve after cable replacement, move to switch port diagnostics.
Can the retransmission baseline catch problems before they cause visible slowness?
Yes. A baseline check during a scheduled monthly maintenance review — even when no slowness has been reported — can reveal a retransmission rate that has increased from 0.3% to 1.8% since the previous check. That increase indicates an emerging physical or configuration problem that has not yet grown severe enough to produce visible media load delays during normal conditions, but will do so during event-day peak load. Catching the problem at 1.8% means scheduling a cabling inspection during a free period; missing it until the display is slow during homecoming means an emergency repair under time pressure.
How does the TCP retransmission baseline relate to touch sensitivity on recognition displays?
They are independent diagnostics for different problems. A TCP retransmission baseline diagnoses network-layer causes of slow media loads. Touch sensitivity issues — input registration accuracy and latency on the touchscreen — are a separate hardware concern unrelated to TCP behavior. A display can have a healthy retransmission rate and a degraded touch response, or vice versa. If a display has both slow media loads and unresponsive touch input, treat them as separate diagnostic cases requiring separate procedures.
Keeping Recognition Displays Ready for Every Event
A school recognition display’s value is realized when athletes, families, alumni, and community members stand in front of it and see the school’s history delivered clearly and quickly. A TCP retransmission baseline gives IT teams the specific, location-calibrated reference point they need to confidently diagnose slow media loads — within minutes of a report, directing blame to the network or the application based on measured evidence rather than guesswork.
The baseline itself is established in a single 15-minute capture window. Once documented and stored in the display’s maintenance record, it remains valid until infrastructure changes or baseline drift warrants a refresh. The operational value it delivers — faster diagnostics, fewer unnecessary cable replacements, more precise vendor escalations, and pre-event confidence checks — pays back the capture effort many times over across the school year.
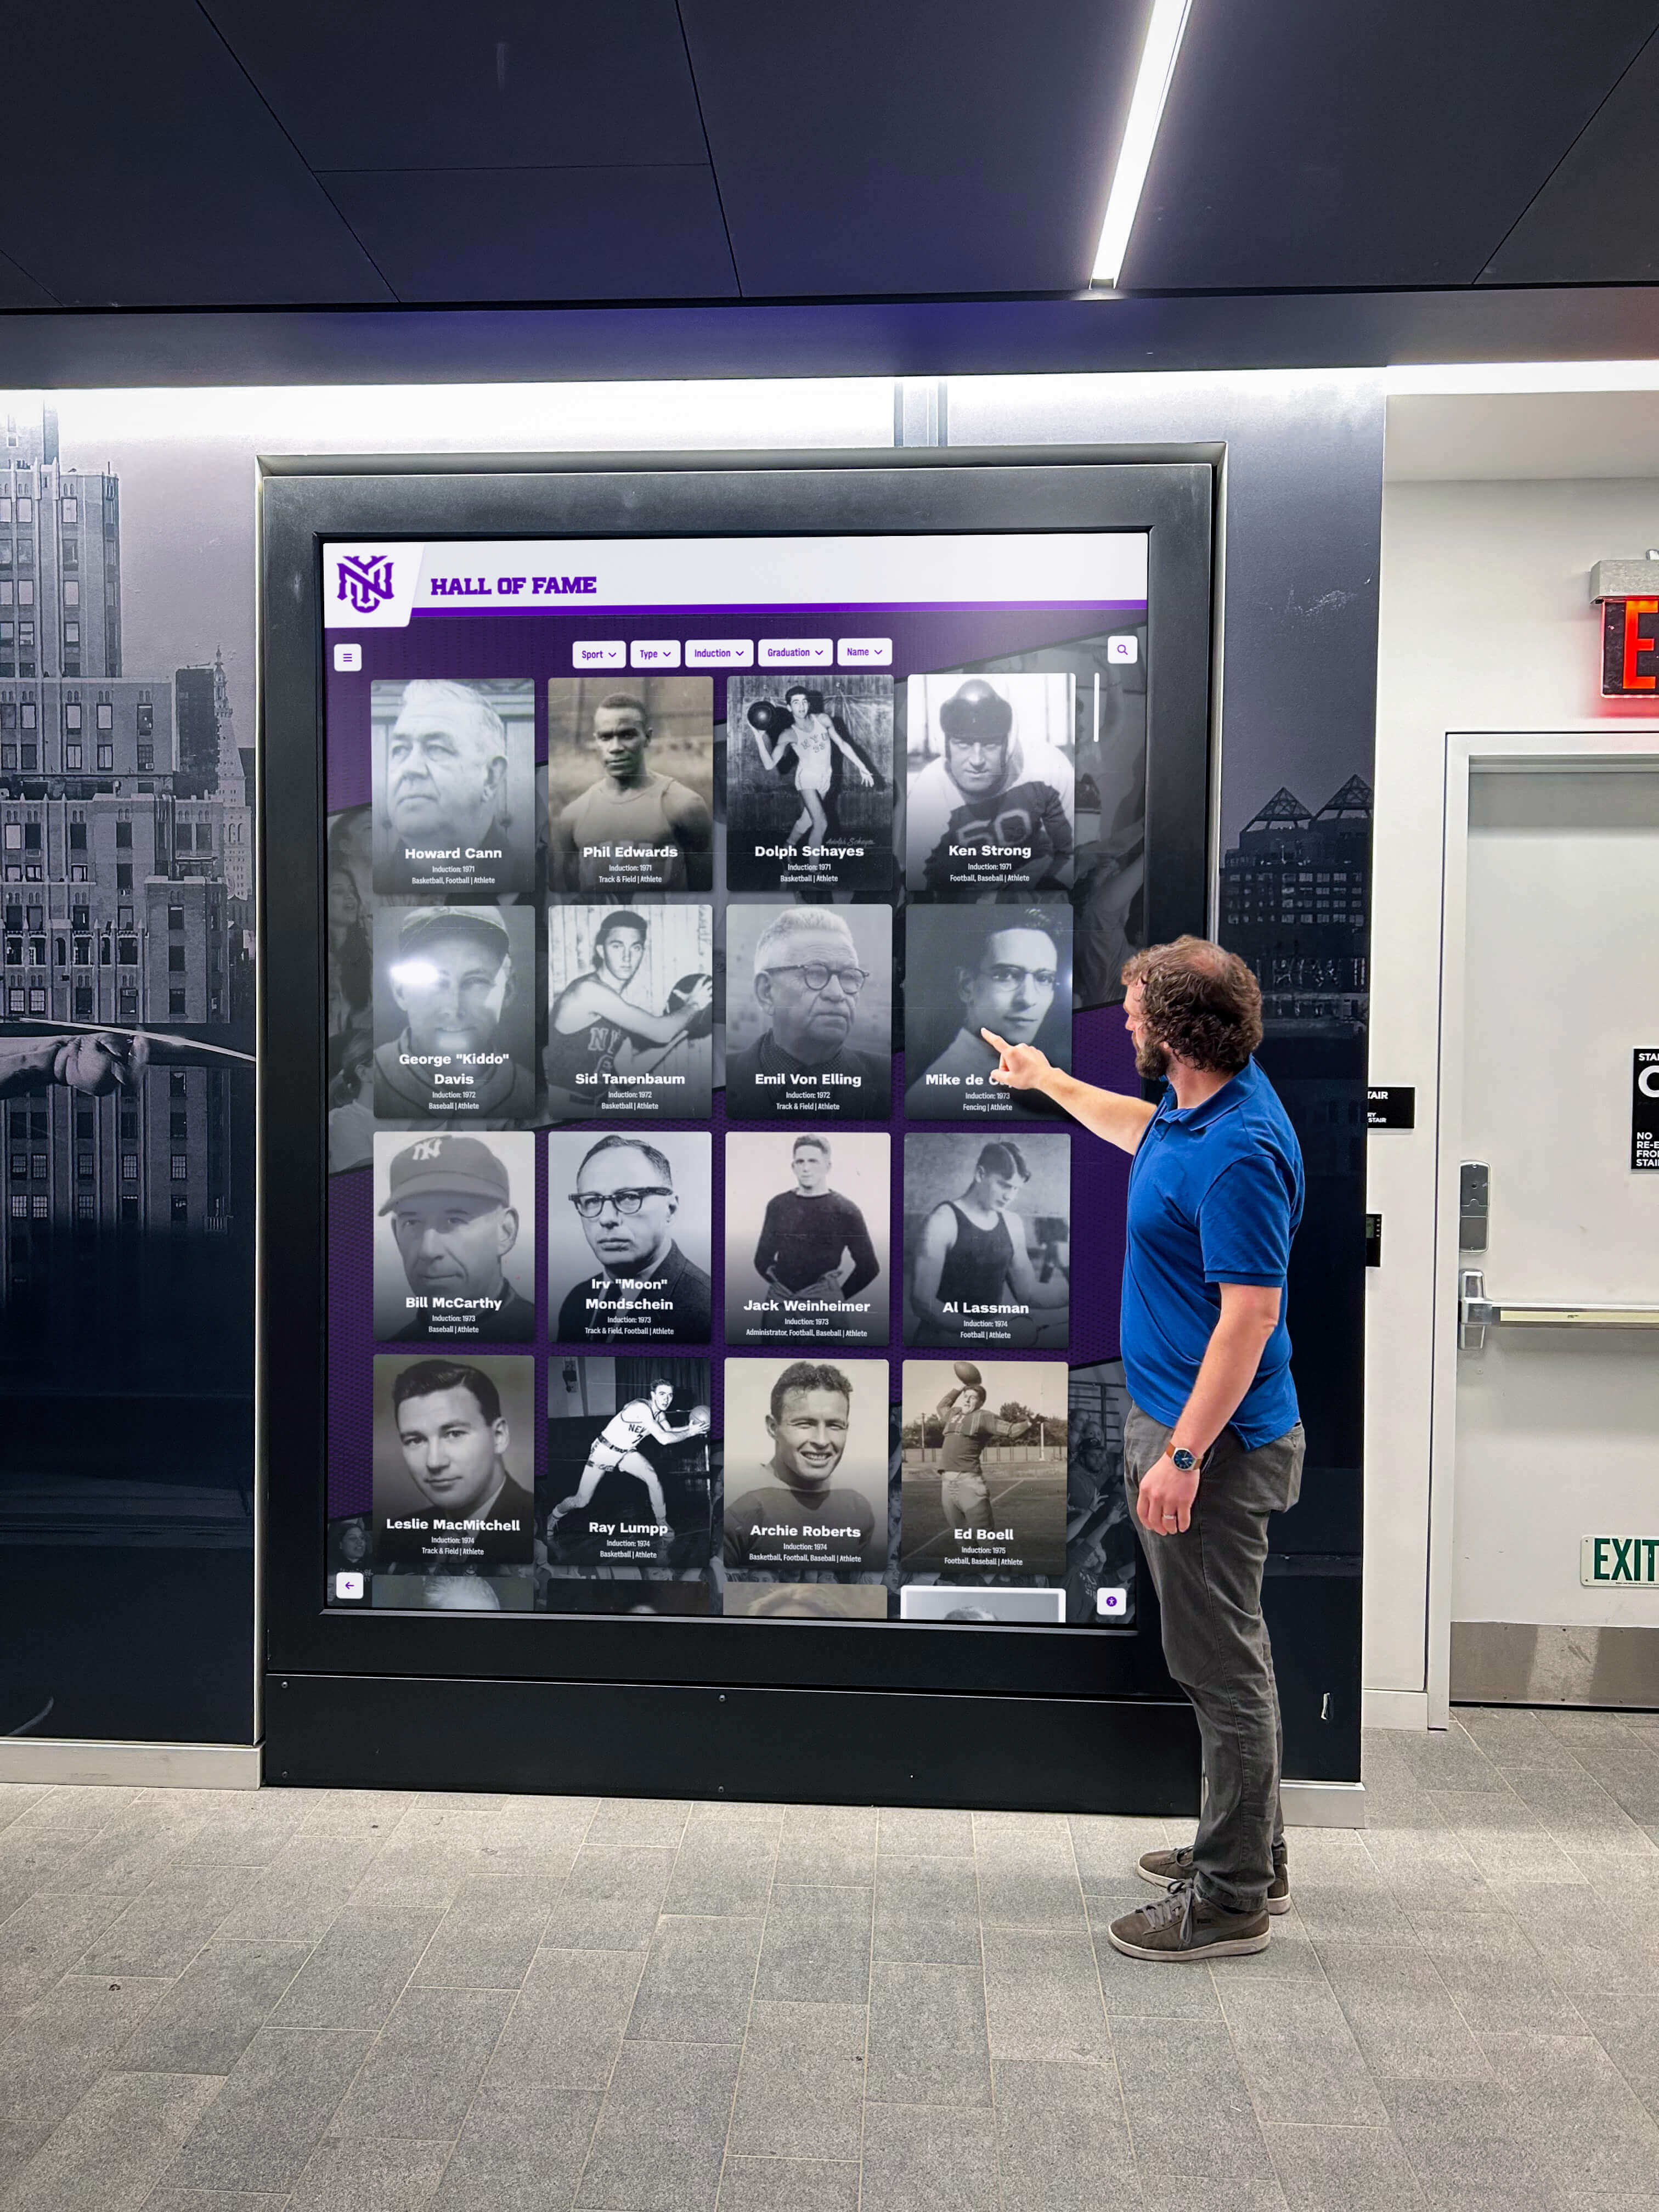
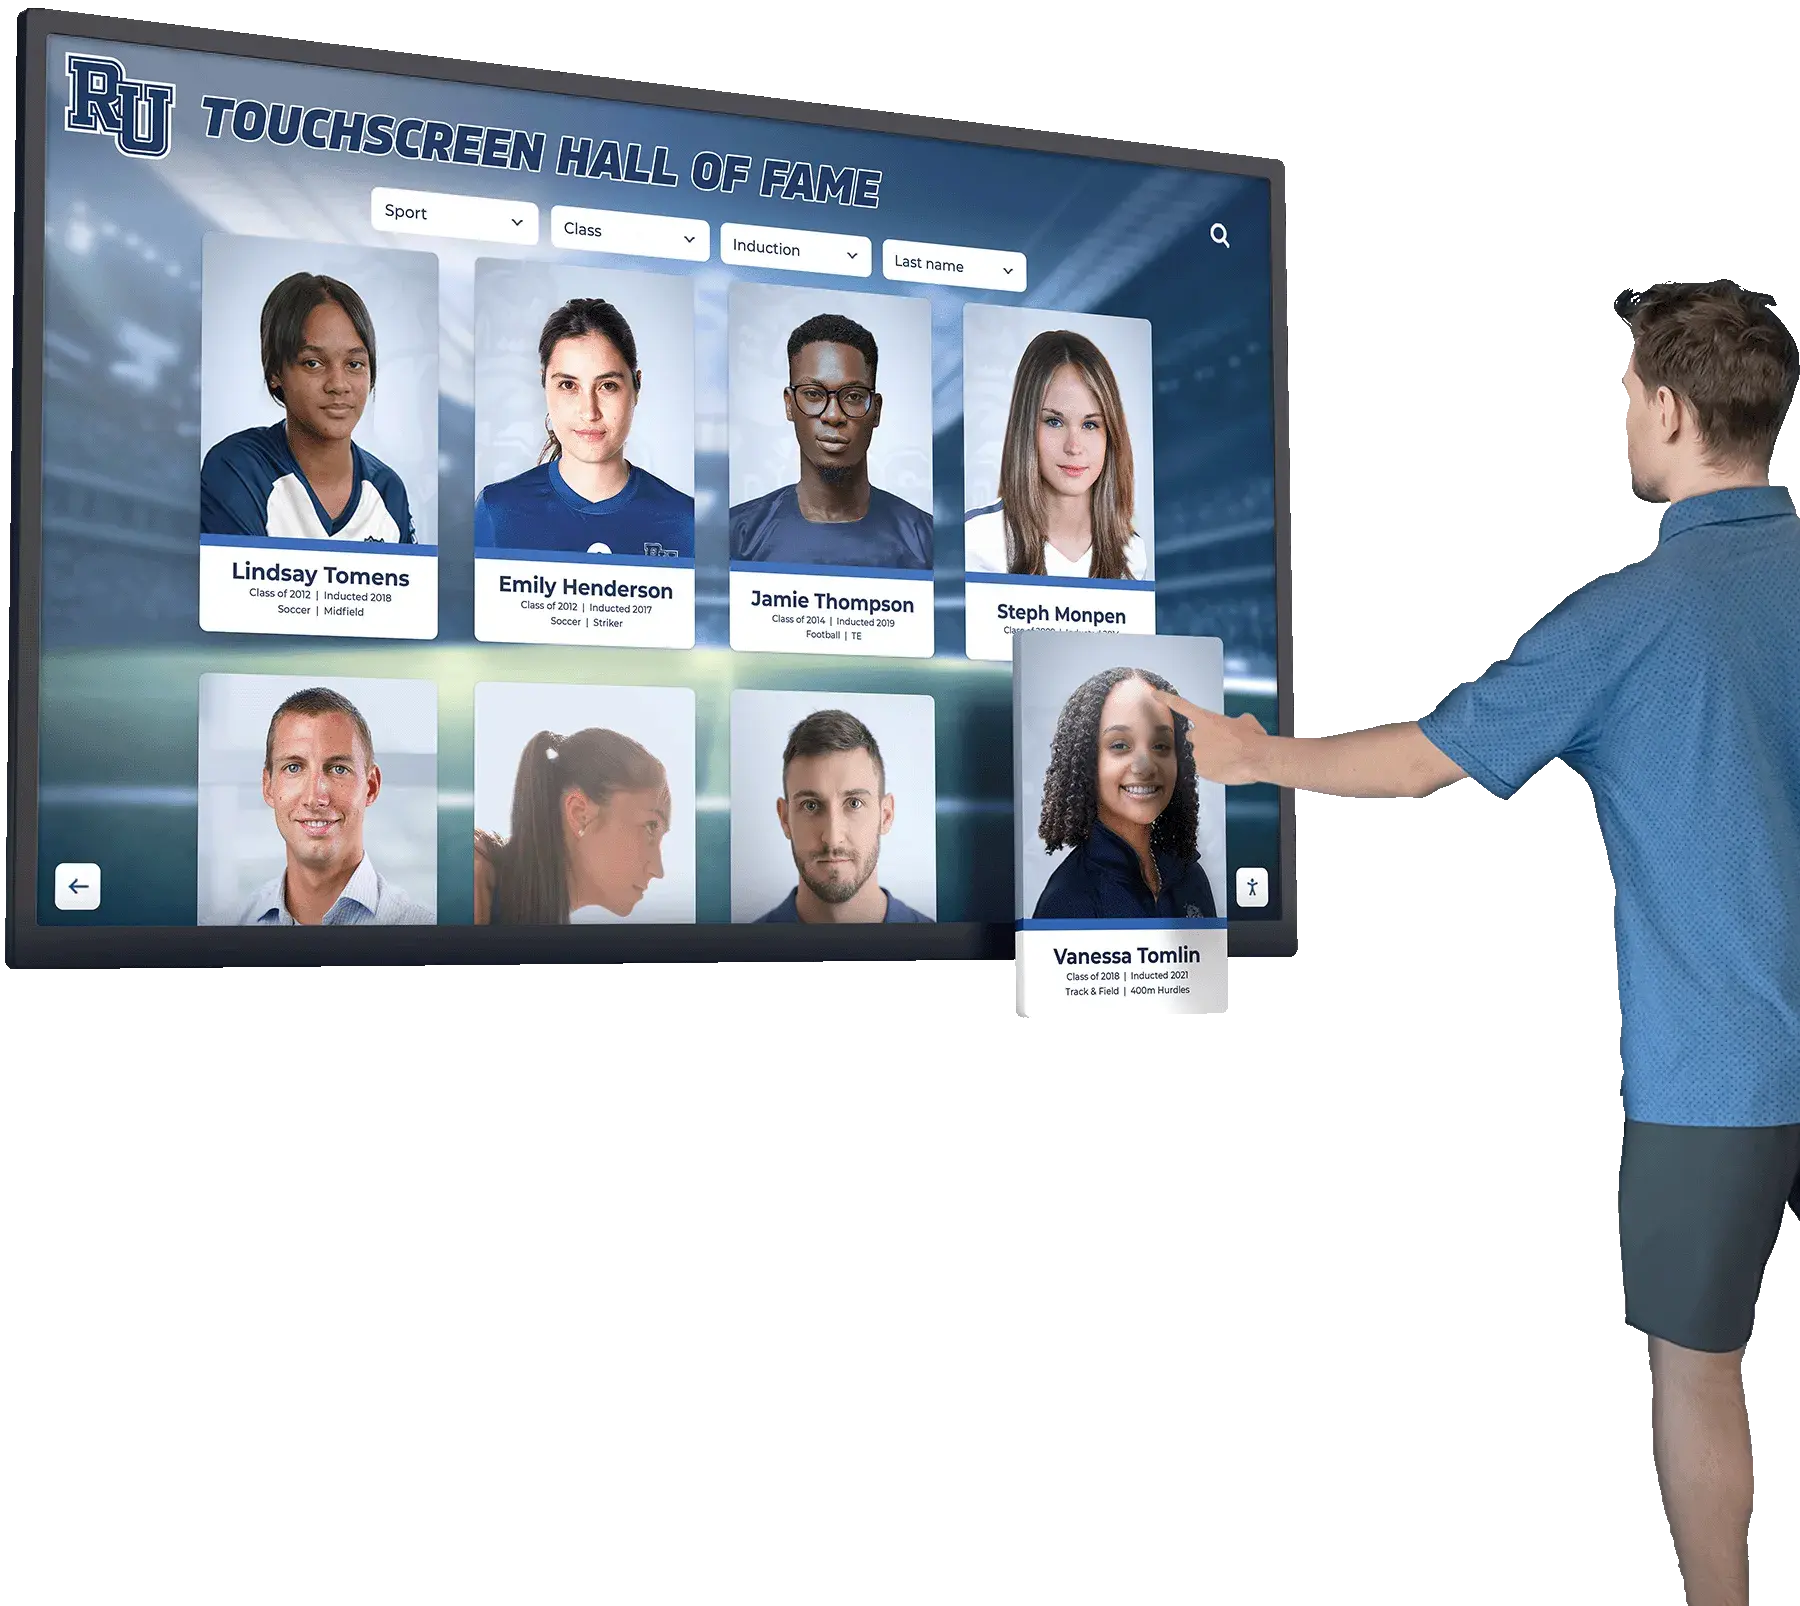
A recognition display baseline serves the community members who use it — consistent media delivery during the moments that matter most, from opening-day visits to championship ceremonies and hall of fame induction nights
See How Rocket Alumni Solutions Supports Reliable School Display Deployments
Rocket Alumni Solutions builds recognition platforms designed to operate reliably on managed school networks, with IT documentation and compatibility resources to support network teams establishing baselines and diagnosing connectivity issues on hall of fame displays and athletic recognition kiosks. Request a demo to see how the platform works with your school's IT environment.
Request a Recognition Display Demo